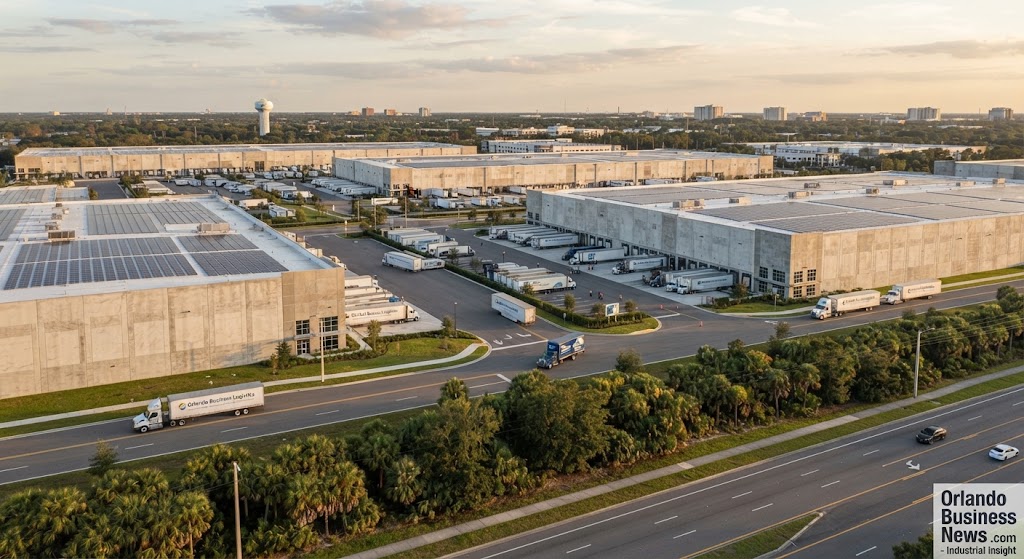
Top Distribution Corridors and Warehouse Costs
Quick Answer: Orlando’s industrial market spans roughly 200 million square feet across corridors anchored by I-4, Florida’s Turnpike, SR-528, and Orlando International Airport (MCO). Following a record post-pandemic construction wave, big-box vacancy has loosened while small-bay space under 20,000 SF remains scarce. NNN asking rents cluster in the high single digits to low teens per square foot, varying sharply by submarket. [Verify current-quarter figures against CBRE/Cushman & Wakefield data before publication.]
Introduction & Executive Summary
Central Florida’s industrial real estate market has completed one full cycle in compressed time: pandemic-era demand shock, a historic development response, and a post-expansion calibration in which the market is now sorting winners by corridor, building format, and bay size. For tenants, the environment is bifurcated — genuine negotiating leverage in new big-box product, and persistent scarcity in the small-bay segment that serves contractors, last-mile operators, and regional distributors. For developers and investors, the question has shifted from “how fast can we deliver” to “which corridor and which format still pencil.”
This article maps the market at the level of decision-making granularity: the specific distribution corridors, the interchange-level logic that drives rents, the structural causes of the big-box/small-bay bifurcation, and a procedural playbook for tenants and developers negotiating in current conditions. Throughout, the analysis is organized around the transport spine that defines Orlando logistics — Interstate 4, Florida’s Turnpike, SR-528 (the Beachline Expressway), SR-417, SR-429 (the Western Beltway), and US-441 — and the freight nodes they connect: Orlando International Airport (MCO), Orlando Sanford International Airport (SFB), the CSX and Florida Central rail corridors, and the Taft rail-served district in south Orange County.
Three theses frame everything that follows:
- Orlando is a population-serving distribution market first and a through-freight market second. The metro’s industrial demand is driven by the consumption of Central Florida’s own fast-growing population and visitor economy, plus the ability to reach the majority of Florida’s population within a roughly four-hour drive.
- The 2021–2024 supply wave permanently repositioned the market. Tens of millions of square feet of new Class A product — concentrated along SR-429 in the northwest, the Airport/Southeast corridor, and the I-4 corridor toward Lakeland — lifted overall vacancy from historic lows and created, for the first time in years, real tenant options above 100,000 SF.
- Small-bay is the structurally undersupplied format. Land economics, construction costs, and institutional capital preferences all disfavor new sub-20,000 SF product, keeping vacancy in that segment tight even as headline vacancy rises.
Section 1: Macro Overview of Central Florida Logistics
Why is Orlando a strategic distribution location within Florida?
The core geographic fact is reach. From central Orange County, a truck can serve Tampa Bay in roughly 90 minutes, Jacksonville in about two and a half hours, and the South Florida tri-county market in three to four hours — placing the majority of Florida’s residents (commonly cited as around 60% of the state’s population) within a four-hour drive radius. No other Florida metro combines that statewide reach with Orlando’s own consumption base: a resident population growing among the fastest of large U.S. metros, plus a visitor economy that generates hotel, food-service, theme park, and event-driven freight volumes with no true analogue in other regional markets.
The arterial system converts that geography into throughput:
- Interstate 4 is the spine, connecting Tampa’s port and distribution base to Daytona and the I-95 corridor, and carrying the metro’s densest truck volumes through downtown Orlando and the tourism corridor.
- Florida’s Turnpike provides the diagonal — the primary link south to Miami-Dade, Broward, and Palm Beach and north toward Ocala and I-75 — making Turnpike interchange access a first-order rent driver.
- SR-528 (Beachline Expressway) connects MCO to Port Canaveral and the Space Coast, and threads through the Airport submarket’s largest bulk distribution parks.
- SR-417 and SR-429 — the eastern and western beltways — opened land for the market’s newest large-format development, with SR-429 in particular unlocking the Apopka/northwest quadrant.
- US-441/OBT and SR-436 carry the infill, small-bay, and service-industrial traffic that supports the metro’s construction and trades economy.
Freight nodes complete the system: Orlando International Airport (MCO), one of the busiest airports in the U.S. and the state’s dominant air-cargo gateway for Central Florida; Orlando Sanford International (SFB) anchoring the north metro; CSX’s mainline and the Taft yard district in south Orange County providing rail-served sites; and Port Canaveral, one hour east via SR-528, adding a container and project-cargo option that has grown its landside logistics ambitions.
How did the market’s inventory evolve, and what does post-expansion calibration mean?
Orlando entered the 2020s as a mid-sized, chronically tight industrial market. The pandemic demand shock — e-commerce acceleration, safety-stock inventory strategies, and Florida’s in-migration surge — pushed vacancy to historic lows and rent growth to double-digit annual rates at the peak. Developers responded with the largest construction pipeline in the market’s history, concentrated in three places: the Airport/Southeast quadrant, the SR-429 corridor through Apopka and Ocoee/Winter Garden, and the I-4 corridor west toward the Disney/Lakeland logistics belt.
The calibration phase began as that pipeline delivered into normalizing demand. The pattern, consistent with national trends: headline vacancy rose from artificial lows as new speculative big-box space delivered; asking rent growth decelerated from peak rates but held onto most of its cumulative gains; construction starts fell sharply as debt costs rose, setting up a thinner delivery schedule ahead. The result today is a two-speed market — described in Section 3 — rather than a uniformly soft one. Tenants reading national headlines about industrial softness and expecting across-the-board concessions in Orlando will find that leverage is real in new bulk product and largely absent in small-bay and infill.
What demand drivers are unique to Central Florida?
Four demand engines distinguish Orlando from generic Sun Belt distribution markets:
- Tourism and hospitality provisioning. Theme parks, the Orange County Convention Center, and one of the nation’s largest hotel-room inventories generate constant food, beverage, linen, FF&E, and event-logistics demand — much of it requiring cooler/freezer space and close-in locations along the I-4 tourism corridor and Taft.
- Construction-economy throughput. The metro’s homebuilding and infrastructure pace sustains building-products distribution, trades contractors, and equipment rental — the archetypal small-bay and outdoor-storage (IOS) tenants.
- Population-serving e-commerce and parcel. National parcel and e-commerce networks have built out regional and last-mile nodes across the Airport quadrant and beltway corridors to serve Central Florida rooftops.
- Aerospace and advanced manufacturing adjacency. The Space Coast’s launch cadence, accessible via SR-528, plus the NeoCity semiconductor district in Osceola County and the simulation cluster near Central Florida Research Park (accessed via SR-417 and University Boulevard in East Orlando), seed specialized flex and manufacturing requirements that generic distribution markets lack.
Section 2: Submarket Deep Dives
What defines the Airport/Southeast Orange County (Lake Nona) submarket?
The Airport quadrant — bounded loosely by SR-528, SR-417, Boggy Creek Road, and Narcoossee Road, and including the Lake Nona periphery — is the market’s institutional bulk-distribution core. Its logic is threefold: direct MCO air-cargo adjacency, immediate SR-528/SR-417/Turnpike access, and large contiguous land positions assembled over decades, including significant aviation-authority-controlled land. Tenancy skews to national distribution: parcel and e-commerce nodes, 3PLs, airline and aviation support, food distribution, and hospitality provisioning. This quadrant absorbed a large share of the post-2021 speculative big-box wave, so it currently offers the market’s deepest menu of new Class A options above 100,000 SF — with corresponding tenant leverage on rate and concessions. Small-bay product here is comparatively scarce and commands a premium from airport-serving businesses.
How do Lake Mary/Sanford and the North I-4 corridor perform?
Seminole County’s industrial base clusters around Sanford — SFB airport, the US-17/92 and SR-46 corridors, and rail-served legacy parks — with flex and light-industrial product spilling toward Lake Mary’s office-flex belt along I-4 and SR-417. The submarket’s profile is regional rather than national: building products, HVAC and trades distribution, boat/RV and consumer-adjacent uses, aviation MRO around SFB, and last-mile serving Seminole and Volusia rooftops. Land constraints and Seminole County’s development posture have kept new supply moderate relative to the beltway corridors, which has protected occupancy; vacancy here typically runs below the metro’s big-box-heavy quadrants, and small-bay space is persistently tight. SR-417’s completion of the eastern beltway gives Sanford product credible reach to the Airport quadrant and the University/Research Park employment base without touching downtown I-4 congestion.
What is driving growth in the Silver Star/Apopka and Northwest corridor?
The northwest quadrant — Silver Star Road, US-441 through Lockhart and Apopka, and the SR-429 corridor — is the market’s newest institutional frontier. Legacy product along Silver Star and US-441 is older-generation, lower-clear-height stock housing the metro’s densest concentration of contractor, trades, and service-industrial users. The transformation is on SR-429: the Western Beltway’s connection from I-4 (near the Disney gateway) north to US-441 and the Wekiva Parkway completion created a bypass around downtown congestion and opened large agricultural land positions in Apopka for modern bulk development. National developers have delivered multiple Class A parks in this corridor, positioning it as the value alternative to the Airport quadrant for regional distribution covering both Orlando and, via the Turnpike’s Ocoee interchange, statewide routes. The tenant profile is broadening from building products and consumer durables toward general regional distribution as the corridor institutionalizes.
How do Southwest Orange County and the Taft/Orlando Central Park district fit the map?
Two additional nodes complete the picture. Southwest Orange/Ocoee–Winter Garden, at the junction of SR-429, the Turnpike, and SR-50, serves the metro’s fastest-growing residential quadrant and the tourism corridor’s back-of-house; it blends new mid-bay product with strong last-mile fundamentals. Taft/Orlando Central Park (south of downtown, along Orange Avenue, McCoy Road, and the CSX corridor) is the legacy heart of Orlando industrial — rail-served, close-in, fully built-out — where older stock trades on location rather than specification, cooler/freezer and food-service distribution concentrates, and infill scarcity keeps effective vacancy low despite dated product. For tenants whose economics depend on drive-time to the tourism corridor or downtown, Taft’s functional obsolescence is priced in and still frequently wins.
Section 3: The Size Bifurcation: Big-Box Availability vs. Small-Bay Scarcity
How is the market bifurcating between big-box and small-bay warehouses?
The defining structural feature of the current Orlando market is divergence by suite size. Availability above roughly 100,000 SF — and especially above 250,000 SF — expanded materially as the speculative wave delivered, giving large tenants multiple credible options in the Airport and SR-429 corridors for the first time in years. Below roughly 20,000 SF, the market never loosened: vacancy in the small-bay segment has remained in the low single digits (commonly reported below 4% in recent cycles), rent growth has outpaced the bulk segment, and landlords retain pricing power, shorter concession packages, and stricter credit standards.
Why does small-bay space under 20,000 SF stay below 4% vacancy?
Five structural causes, none of them cyclical:
- Land economics disfavor new small-bay. Multi-tenant shallow-bay parks yield less rentable area per acre of expensive infill land than bulk product yields on cheap beltway land, and their construction cost per square foot is higher (more demising, more doors, more office finish, more site circulation).
- Institutional capital prefers big-box. Development capital and institutional buyers historically concentrated on single-tenant and bulk formats with credit tenancy; small-bay’s fragmented rent rolls and management intensity kept it a private-owner asset class, suppressing new supply even as investor interest in the segment has recently grown.
- Demand is structurally growing. The small-bay tenant base — trades contractors, restoration and pool companies, e-commerce micro-fulfillment, medical and equipment services — scales directly with Central Florida’s population and construction growth.
- Stock is being removed, not added. Close-in small-bay parks along US-441, Silver Star, and Taft face redevelopment pressure from residential, self-storage, and higher-value uses, shrinking inventory in exactly the locations where demand is deepest.
- Users can’t substitute up. A 12,000 SF user cannot economically occupy a 150,000 SF cross-dock; big-box availability does nothing to relieve small-bay scarcity, so the two segments now price almost independently.
What does the bifurcation mean for rents and concessions?
In practical terms: new bulk product is a tenant’s market — expect negotiability on face rate, meaningful free rent tied to term, and landlord-funded office build-out, particularly on suites that have sat since delivery. Small-bay is a landlord’s market — expect near-asking execution, limited free rent, annual escalations at the high end of the market range, and competition from other tenants for well-located suites. Mid-bay (20,000–100,000 SF) sits between the poles and is the segment where corridor selection most changes the outcome: mid-bay in the Airport quadrant behaves closer to the bulk market; mid-bay in Seminole County or Taft behaves closer to small-bay.
Section 4: Cost Analysis and Comparative Matrix
What are the average NNN asking rents across Orlando’s distribution corridors?
The table below presents the market’s structure with placeholder metrics. Editorial note: insert current-quarter figures from CBRE, Cushman & Wakefield, Avison Young, or WareCRE market reports before publication; ranges shown are indicative of recent market structure and relative positioning only, and move quarterly.
| Submarket | Corridor Anchors | Overall Vacancy Rate | Avg. NNN Asking Rent (PSF/yr) | Primary Tenant Profile |
|---|---|---|---|---|
| Airport / Southeast Orange (incl. Lake Nona periphery) | MCO, SR-528, SR-417, Boggy Creek Rd | [X.X%] — elevated by new bulk deliveries | [$X.XX] — top-of-market for new Class A | National distribution, parcel/e-commerce, 3PL, aviation support |
| Lake Mary / Sanford (Seminole County) | I-4 North, SFB, US-17/92, SR-46, SR-417 | [X.X%] — below metro average | [$X.XX] | Regional distribution, building products, aviation MRO, flex |
| Silver Star / Apopka / Northwest | US-441, Silver Star Rd, SR-429, Wekiva Pkwy | [X.X%] — split: tight legacy stock, lease-up in new parks | [$X.XX] legacy / [$X.XX] new Class A | Contractors and trades (legacy); regional bulk (new SR-429 parks) |
| Southwest Orange / Ocoee–Winter Garden | SR-429, Turnpike, SR-50 | [X.X%] | [$X.XX] | Last-mile, consumer distribution, tourism back-of-house |
| Taft / Orlando Central Park / South Orange | Orange Ave, McCoy Rd, CSX rail, SR-528 | [X.X%] — structurally low (infill, no new supply) | [$X.XX] — location premium on dated product | Food/cooler-freezer, hospitality provisioning, rail-served users |
| Osceola / South Metro (incl. NeoCity adjacency) | Turnpike, US-192, Florida’s Turnpike–SR-417 junction | [X.X%] | [$X.XX] | Emerging bulk, advanced manufacturing adjacency |
How do cap rates and investment volumes frame the market?
Directionally, Orlando industrial cap rates compressed to historic lows during the 2021–2022 capital-markets peak, then widened with interest rates alongside all major markets, with the spread between stabilized Class A bulk and multi-tenant small-bay narrowing as institutional capital re-rated the small-bay segment’s rent-growth profile. Institutional transaction volume is concentrated in the Airport and SR-429 corridors, where new Class A product trades in portfolio and single-asset form; Taft and legacy infill trade largely among private and value-add buyers underwriting rent mark-to-market and, increasingly, covered land plays.
| Metric | Big-Box / Class A Bulk | Small-Bay / Multi-Tenant | Notes for Verification |
|---|---|---|---|
| Stabilized cap rate range | [X.X%–X.X%] | [X.X%–X.X%] | Source: current investor surveys (CBRE Cap Rate Survey, C&W) |
| Recent annual rent growth | Decelerated from peak | Outpacing bulk segment | Source: quarterly market reports |
| Typical concessions | Free rent tied to term; TI on office build-out | Minimal | Market-standard, deal-specific |
| Institutional sales volume share | Majority of metro dollar volume | Growing but minority | Source: MSCI/Real Capital Analytics, brokerage capital-markets reports |
What occupancy cost items should tenants model beyond base rent?
NNN structure means base rent is the beginning of the occupancy-cost model, not the end. Central Florida-specific line items to underwrite: property insurance (Florida’s insurance market has repriced sharply and windstorm coverage is a real differential versus other states — obtain the landlord’s actual insurance pass-through history, not an estimate); property taxes on newly delivered or recently traded buildings (reassessment after an institutional sale can step up the tax pass-through materially); CAM on newer master-planned parks versus legacy stock; and utility capacity charges for cooler/freezer or power-intensive uses. A building quoted a dollar below a competitor can be more expensive occupied once insurance and reassessed taxes flow through.
Section 5: Strategic Playbook for Tenants and Developers
A 5-Step Evaluation Checklist for Leasing Industrial Space in Central Florida
- Fix the corridor before the building. Model outbound drive-times from candidate interchanges — Turnpike access for statewide distribution, SR-528 for airport/Space Coast flows, SR-429 for west-metro and bypass routing, I-4 for the tourism corridor — against your actual delivery matrix. In Orlando, the interchange decision moves total logistics cost more than a $0.50 rent differential.
- Match format to the bifurcation. If your requirement exceeds 100,000 SF, run a genuine competition among new Class A options in the Airport and SR-429 corridors and negotiate concessions aggressively. If your requirement is under 20,000 SF, compress your decision timeline, prepare financials in advance, and prioritize suite fit over rate negotiation — well-located small-bay does not wait.
- Underwrite full NNN occupancy cost. Demand three years of operating-expense history, the current insurance premium and carrier, and the tax parcel’s assessment trajectory. In Florida’s current insurance environment, this diligence step routinely re-ranks a shortlist.
- Verify functional specifications against your operation. Clear height, truck-court depth (130’+ for full-size trailer operations), dock-door ratio, trailer/car parking counts, power (heavy three-phase for manufacturing or EV fleet charging), sprinkler classification (ESFR for high-pile), and — critical in Central Florida — any cooler/freezer infrastructure condition and age. Older Taft and Silver Star stock trades on location precisely because it fails several of these tests.
- Negotiate term structure to the cycle. In new bulk product, trade longer term for larger concession packages and cap annual escalations; in small-bay, secure renewal options with defined (not “market”) escalation language, since the scarcity that helps landlords today will otherwise reprice you at every renewal.
How should developers position new projects in the current phase?
The speculative bulk window has narrowed; the underwriting that pencils now is (a) small-bay and shallow-bay multi-tenant product on infill or near-infill sites — the segment with proven sub-4% vacancy and rent power; (b) build-to-suit and pre-leased bulk for credit tenancy; (c) IOS (industrial outdoor storage) positions serving the construction economy, where county-level zoning scarcity creates durable pricing; and (d) cooler/freezer, which Central Florida’s food-and-hospitality base structurally undersupplies. Entitlement risk is the region’s under-priced variable: municipalities from Apopka to Osceola County are actively recalibrating industrial land-use policy, and residential encroachment along SR-429 and US-441 is tightening the buffer requirements and truck-route conditions attached to approvals.
What lease structures and concessions are achievable right now?
In new Class A bulk: free rent commonly scales with term; landlord-funded office build-out is negotiable; and face rates on long-vacant suites can move meaningfully for credit tenants — with landlords preferring to protect face rate via concessions rather than cut it. In mid-bay: expect modest concessions, corridor-dependent. In small-bay: expect near-asking deals, personal guarantees or security deposits for non-credit tenants, and escalations at the top of the market range. Across all formats, insurance and tax pass-through volatility is the clause set to negotiate hardest: caps on controllable CAM, audit rights, and clarity on windstorm-deductible allocation are worth more than they cost in negotiating capital.
Frequently Asked Questions: Orlando Industrial Real Estate
Is Orlando’s industrial market overbuilt?
Segment-dependent. The bulk segment absorbed a historic delivery wave and is working through lease-up in the Airport and SR-429 corridors — a normal calibration, aided by a sharply reduced construction pipeline. The small-bay segment is, if anything, underbuilt, with structural constraints (land cost, construction economics, redevelopment losses) that new supply is unlikely to resolve. Metro-level vacancy statistics blend these two realities and should not be quoted without the size-segment split.
How do Orlando warehouse costs compare to Tampa, Jacksonville, and South Florida?
Directionally: South Florida is the state’s most expensive industrial market by a wide margin; Orlando and Tampa compete in a similar band, with Orlando’s newest Airport-corridor Class A pricing at the top of its range; Jacksonville, with deeper port-driven bulk supply, generally prices below both. Lakeland/Polk County — the I-4 midpoint — remains the value alternative for statewide distributors willing to trade Orlando adjacency for lower rents, and functionally competes with west-metro Orlando product for large requirements. Current per-market figures should be drawn from the same quarterly brokerage reports cited below.
What role does Orlando International Airport play in industrial demand?
MCO is Central Florida’s air-cargo gateway and one of the busiest passenger airports in the country, and its aviation authority controls substantial developable land on the airfield’s east and south sides. Beyond direct air-cargo users, the airport concentrates aviation support, in-flight provisioning, parcel-network air nodes, and time-sensitive distribution in the surrounding quadrant — and the Brightline intercity rail station at MCO has added a passenger-infrastructure anchor that reinforces the quadrant’s long-term land values.
What should out-of-state tenants know about Florida-specific occupancy costs?
Three items: property insurance pass-throughs have repriced across the state and vary meaningfully by building age and construction type; Florida applies sales tax to commercial rent (a state-specific line item that has been legislatively reduced in steps — verify the current rate with counsel); and hurricane preparedness carries real operational cost (generator provisions, windstorm deductibles, business-continuity planning) that should appear in any total-cost comparison against non-coastal markets.
About the Author
Brian French is a financial analyst, digital media publisher, and corporate strategist with extensive professional experience across investment analysis, financial advisory, and trust portfolio management at institutions including Shearson American Express, SunTrust, and Merrill Lynch. As the publisher of the Florida Authority Network and OrlandoBusinessNews.com, Brian specializes in regional economic development, Answer Engine Optimization (AEO), enterprise content architectures, and B2B commerce dynamics across Central Florida.
References and Sources
Editorial note: all bracketed metrics, rent figures, vacancy rates, and cap-rate ranges in this article must be populated and verified against the current-quarter editions of the sources below prior to publication.
- CBRE Research. Orlando Industrial Figures (quarterly market report). cbre.com
- Cushman & Wakefield Research. Orlando Industrial MarketBeat (quarterly). cushmanwakefield.com
- Avison Young. Orlando Industrial Market Report (quarterly). avisonyoung.com
- WareCRE / regional industrial brokerage market benchmarks, Central Florida distribution corridor data.
- Orlando Economic Partnership. Regional infrastructure and logistics reports. orlando.org
- Florida Department of Transportation. Freight and interstate logistics data; SIS (Strategic Intermodal System) corridor documentation. fdot.gov
- Greater Orlando Aviation Authority. MCO air-cargo statistics and land-development documentation. orlandoairports.net
- Canaveral Port Authority. Cargo and landside logistics reporting. portcanaveral.com
- MSCI Real Capital Analytics / brokerage capital-markets reports. Orlando industrial investment sales volume and cap-rate data.
- U.S. Census Bureau and Bureau of Economic and Business Research (BEBR), University of Florida. Central Florida population growth and drive-time demographics.